Performance
ome best-practices and guidelines when it comes to performance.
💡 Tip!
The Profiler and Frame Debugger are invaluable tools to get an insight in the rendering process of your project. Each step of the outline/fill effect will be shown within the frame debugger so you can see what's going on.
Jump to heading Batching
Read gpu instancing for more information.
Jump to heading Mobile
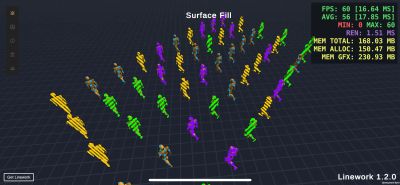
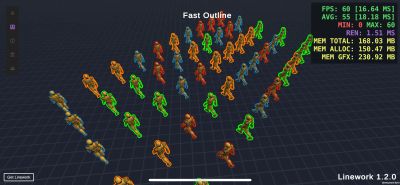
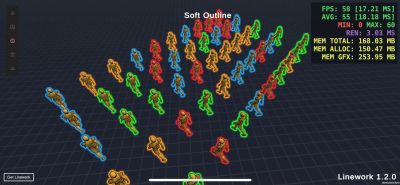
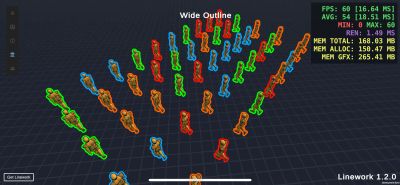
Some performance tests were done on iOS using a base model iPhone 15.
Skinned Mesh Renderers
This scene consists of 50 animated skinned mesh renderers, with each time 4 types of outlines/fills applied. Screenshots are shown in the following order: surface fill, fast outline, soft outline, wide outline.
400 Outlines
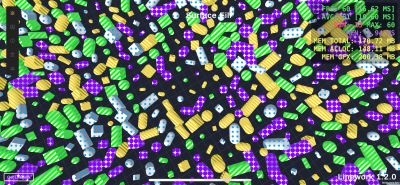
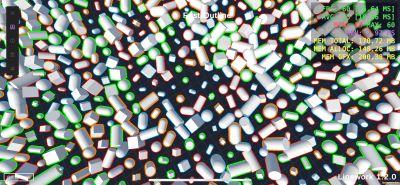
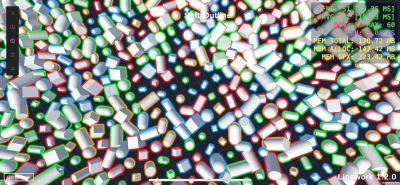
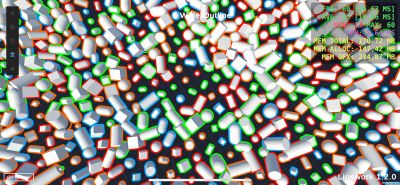
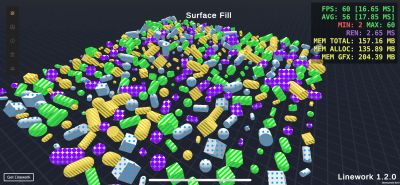
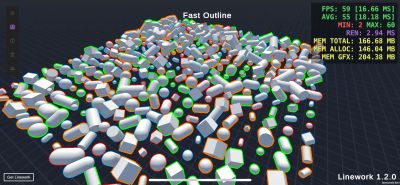
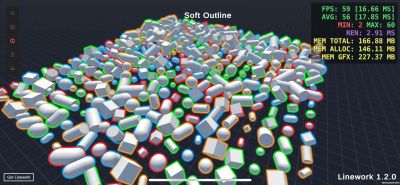
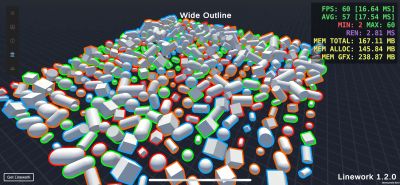
This scene consists of 400 meshes, with each time 4 types of outlines/fills applied. Screenshots are shown in the following order: surface fill, fast outline, soft outline, wide outline.
900 Outlines
This scene consists of 900 meshes, with each time 4 types of outlines/fills applied. Screenshots are shown in the following order: surface fill, fast outline, soft outline, wide outline.
